AI Trends Report User Guide
Your complete guide to understanding every section of the AI Trends Report
14 tabs • Comprehensive intelligence • Built for executive decision-making
What is the AI Trends Report?
The AI Trends Report is a key feature of the AI Intelligence LIVE platform, designed to provide strategic intelligence and insights into the latest developments and shifts within the AI industry. This report is particularly beneficial for professionals who need to stay informed about the competitive landscape, emerging opportunities, and potential threats in the AI sector.
Key Characteristics
Weekly Industry Intelligence
Curated weekly to ensure information is current and relevant to ongoing developments in the AI field.
Strategic Focus
Targets strategy teams, executives, innovation leaders, and investors tracking AI industry shifts for actionable decision-making.
Comprehensive Coverage
Processes thousands of articles and distills vast amounts of information into concise, targeted intelligence.
Precision-Targeted Intelligence
Tailored to reflect specific industry needs, roles, and strategic priorities — minimizing noise, maximizing value.
10–15 Minute Read
Transforms hours of research into a brief yet comprehensive overview, enabling quick adaptation to industry changes.
Enhanced Decision-Making
Identifies trends, opportunities, and threats ahead of competitors so you can act with confidence and speed.
Practical Applications
Strategy Development
Refine initiatives aligned with emerging trends
Competitive Analysis
Monitor market shifts and anticipate changes
Investment Decisions
Identify promising areas by analyzing opportunities
Innovation Planning
Guide R&D efforts aligned with industry movements
In summary: The AI Trends Report from AI Intelligence LIVE is an invaluable tool for professionals seeking to leverage AI-driven insights for strategic advantage. By providing precise, actionable intelligence, it empowers leaders to make informed decisions, optimize strategies, and stay ahead in a rapidly evolving industry landscape.
Report Tabs Overview
Click any tab below to jump to its detailed guide, or scroll through all 14 tabs.
The Executive Overview is your starting point. It provides a bird's-eye view of the entire report with key performance indicators (KPIs) and trend comparisons.
KPI Cards (4 Metrics)
Articles Analyzed
Total number of AI news articles processed for this report. Shows trend arrows (↑ up, ↓ down, → stable) compared to the previous report.
Industries Covered
How many industries are represented in the analysis.
Unique Sources
Number of distinct news sources used for data collection.
Report Confidence
A score out of 100 indicating how confident the AI is in its analysis based on data quality and volume.
Executive Summary
A comprehensive narrative summary of the entire report's key findings, written in clear business language.
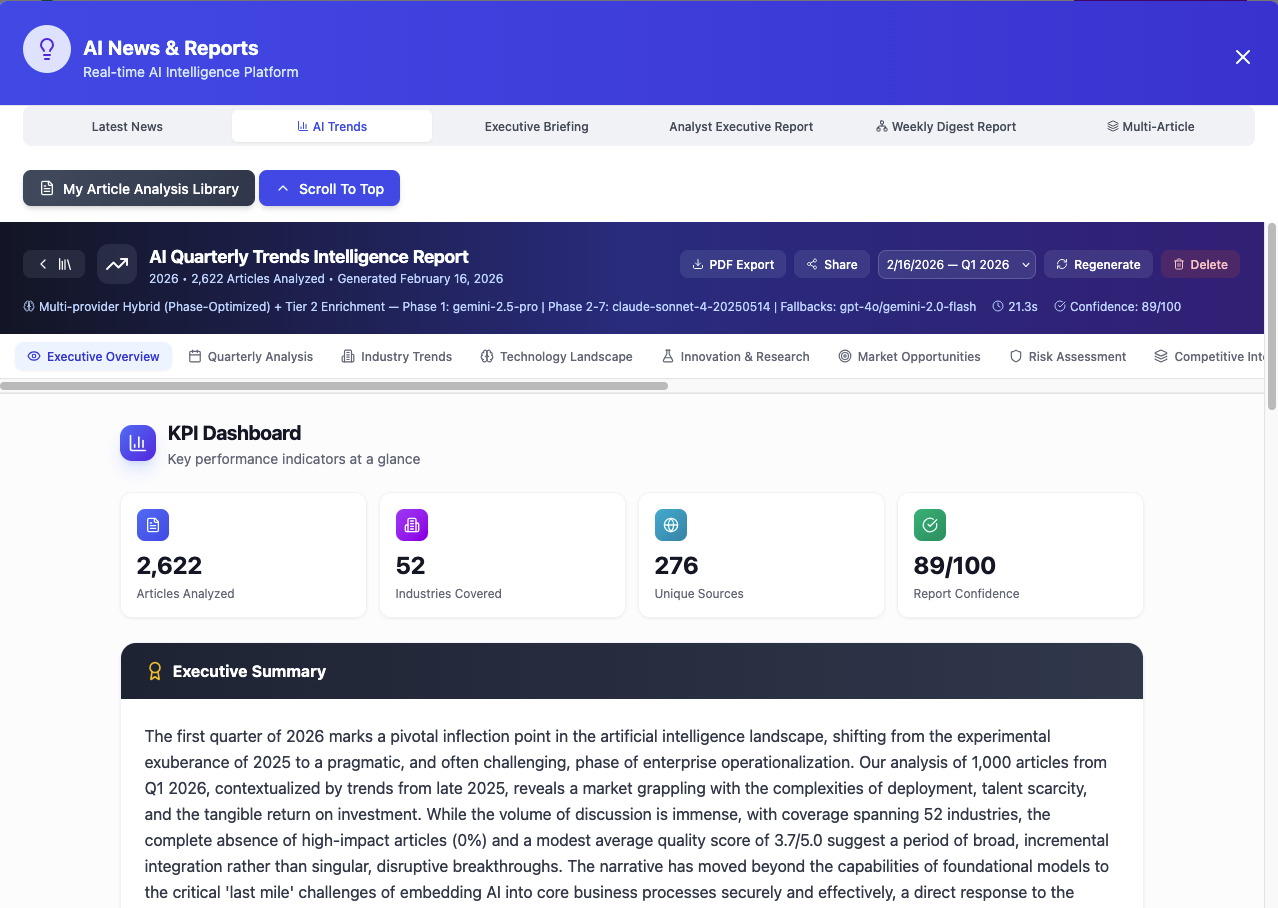
Screenshot: AI Trends Report — Executive Overview with KPI Cards and Executive Summary
Quarterly Article Distribution
A visual bar chart showing how many AI news articles were analyzed in each quarter (Q1–Q4) of the reporting year. Each bar displays the article count and the percentage of the total. This helps you instantly see which quarters had the most AI coverage and activity. For example, if Q1 shows 1,000 articles at 39% while Q2–Q4 show 0, it means all analyzed content falls within Q1 — a common pattern for newly generated reports early in the year.
Top Categories
A ranked list of the most prominent AI topic categories found across all analyzed articles. Each category shows its article count, letting you see which areas of AI are generating the most news coverage. Categories include areas like "AI in Software Development & IT Services," "AI in Government & Public Policy," "AI Infrastructure & Cloud Platforms," "AI Business Strategy & ROI," and more. This ranking tells you where the conversation is concentrated and which sectors are seeing the most AI-related activity.
Quarterly Sentiment Trend
A quarter-by-quarter sentiment score (out of 100) that measures the overall tone and optimism of AI news coverage during each period. Higher scores indicate more positive, optimistic coverage, while lower scores suggest caution or negativity. Tracking sentiment across quarters helps you spot shifts in market confidence — for instance, a declining sentiment trend could signal growing concerns about regulation, market saturation, or technology limitations.
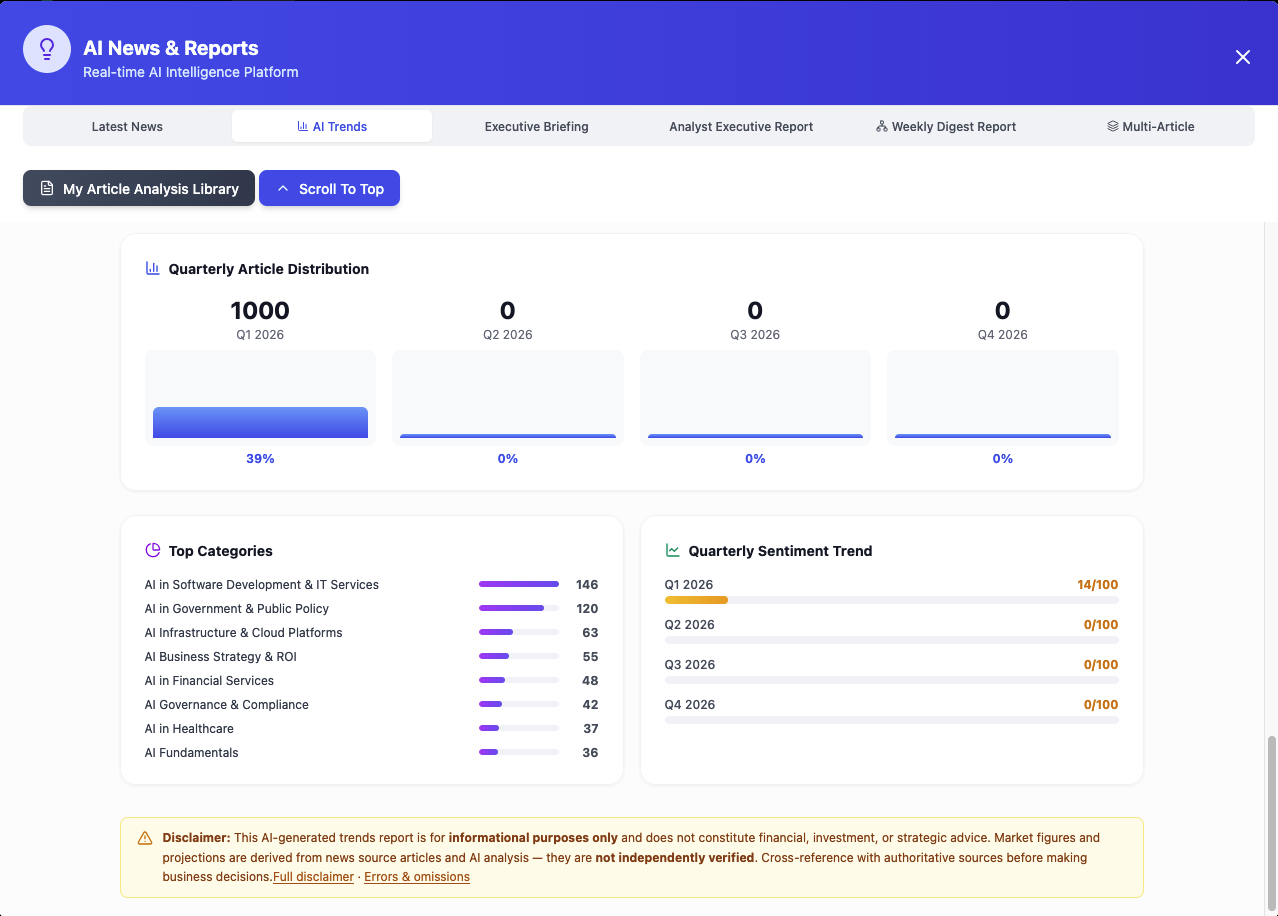
Screenshot: AI Trends Report — Quarterly Article Distribution & Sentiment Trend
How to Use Executive Overview
Start here every time you open a new report. The Executive Overview is your dashboard — it gives you the full picture before you dive into any detailed section.
- KPI Cards:Check the four headline metrics first. Look at the trend arrows — if "Articles Analyzed" is trending up (↑), the AI landscape is getting busier. A high "Report Confidence" score (80+) means you can trust the analysis. Compare "Industries Covered" and "Unique Sources" against previous reports to see if coverage is broadening.
- Executive Summary:Read this for a plain-English overview of the entire report's findings. Use it to quickly brief stakeholders or write internal memos — it distills hundreds of articles into the key takeaways without requiring you to read every section.
- Quarterly Article Distribution:Scan the bar chart to see which quarters had the most AI news activity. A spike in a specific quarter may indicate a major product launch, regulatory change, or industry shift. If all articles fall in one quarter, it reflects the report's data window — expect fuller distribution as the year progresses.
- Top Categories:Identify which AI topic areas are dominating the news. If your industry appears high on the list, it means AI activity in your sector is significant. If it's missing or low, it could mean fewer developments — or an untapped opportunity. Use this to prioritize which report sections to read in detail.
- Quarterly Sentiment Trend:Watch for rising or falling sentiment scores. A declining trend may signal growing market concerns about regulation, competition, or technology risks — good for risk planning. A rising trend suggests increasing optimism and investment momentum — good for opportunity hunting. Compare sentiment shifts against the article distribution to see if more coverage correlates with more positive or negative tone.
General Tips & Best Practices
Searching & Filtering
- • Use the Industry Filter available in tabs 3, 6, and 7
- • Set up Preferred Industries in Preferences for personalized highlights
Competitor Tracking
- • Set up your company profile in Preferences
- • Tab 13 auto-scans every report for competitor mentions
Export & Sharing
- • Download PDF for offline reading or presentations
- • Use Share button for shareable team links
Report Library
- • All generated reports are saved in the Report Library
- • Search by quarter, year, AI provider, or keywords
- • Delete old reports to keep your library organized